- TPDS-web operation manual -
release date:2009/02/02
TPDS-web/full operating procedure
3.1 How to search material
To search material or property you want, 1.use the material trees or 2.use the material search function of simple search.
3.1.1 Search by the material trees
Figure 3-1 is the material trees. It is expanded by clicking a folder icon or name. To collapse a folder, click the minus (-) icon next to. It is not collapsed by clicking a folder name. The folder with red character is the folder one is currently viewing. If you take Aluminum, for example, you can browse the data by expanding in the following order: Solids and Melts> Metal> p-block metal> Aluminum. After you use TPDS-web several times and understand the folder structure, you can reach data more quickly than other search method.
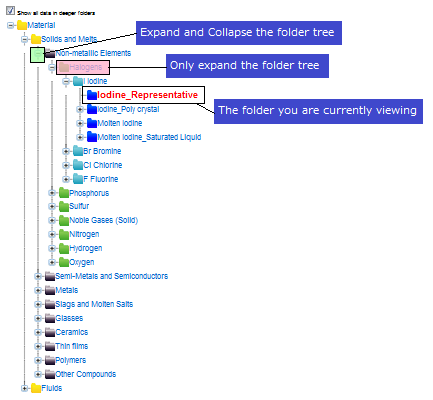
Figure 3-1 Material trees
3.1.2 Search by simple search function
Figure 3-2 is the simple search screen. You can search by property name and material name by using this function.To search property, select a property name from the pull-down menu and click "Start Search" button. The material search is partial match retrieval only from input item. The search by multiple material names is not available. And material name is available for English name only. The search range for the material name is from the 3rd hierarchy (material group 1) to the 8th hierarchy (measurement sample) of material trees. Only "AND" search is possible between material name and property name. If both are blank, it will not start when you click "Start Search" button. The material folder that contain appropriate property data are displayed in a search result frame. From that folder, you can jump to appropriate folder in the material trees directly.
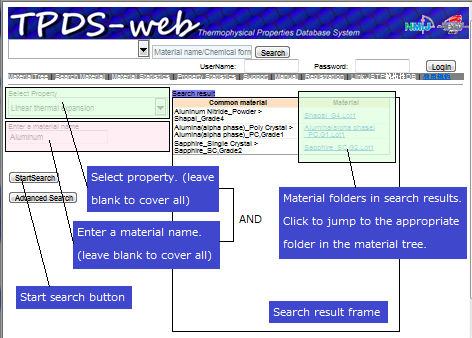
Figure 3-2 Simple search screen
You can also use the simple search function on the main screen. Figure 3-3 is the simple search screen (main screen). As the function previously described, you can search by property name and material name. The material folder that contain appropriate property data are displayed in a search result frame. From that folder, you can jump to appropriate folder in the material trees directly.
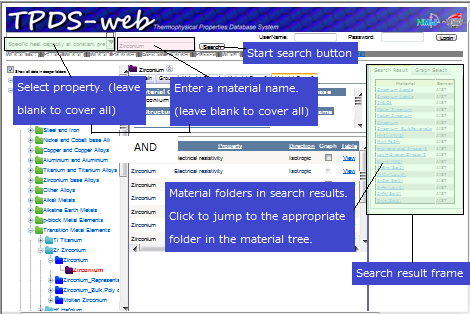
Figure 3-3 Simple search screen (Main screen)
3.2 Browsing of property data
Browsing of property data depends on the authority of login account (or guest account if you are not logged in). Depending on the project that your account belongs to, you may not be authorized to browse the details of table data or equation data. Even in that case, If the property data depends on only one variable, you can make a graph and get a grasp of the entire spectrumthe.
3.2.1 Browsing of table data, equation data and reference information
Figure 3-4 is the zoom of the property data frame. If the table or equation data can be browsed, the link that says "View" is displayed in Table column or Equation column. Click "View", and the details of table or equation data can be browsed. In the same way, click "View" in Reference column, reference information can be browsed. Reference information includes the journal name, volume, issue, year, starting page, author, paper title, and also provides a link to publishing company. In case of an excerpt from a book, it includes book name, ISBN, and also provides a link to publishing company web site.
3.2.2 Graph drawing
To make a graph, check the box in Graph column and click "2D Graph" or "3D Graph" button in the graph select frame on the right side of the screen. Graph will be displayed in a pop-up window. Please check your browser's configuration. To plot multiple property data sets on one graph, check the earch box and click "2D Graph" or "3D Graph" button. In this case, if those properties are the same, you can make a graph, but if those are not the same, you will get errors.
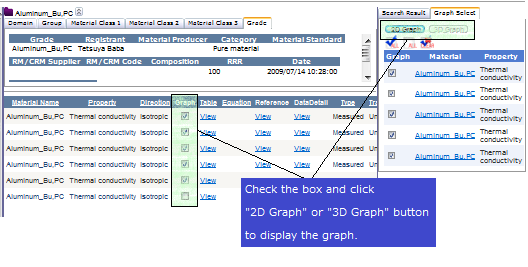
Figure 3-4 Property data frame
3.2.3 Switch to a logarithmic display
Graph display function of TPDS-web/full includes multiple display switching and drawing range changing. Figure 3-5 is an example of a graph. To switch the graph display to logarithmic display, check the box next to "Logarithmic scale in axis" and click "redraw" button. To change minimum and maximum values of graph drawing rang, enter a value into the entry form next to "min" or "max" under a graph and click "redraw".
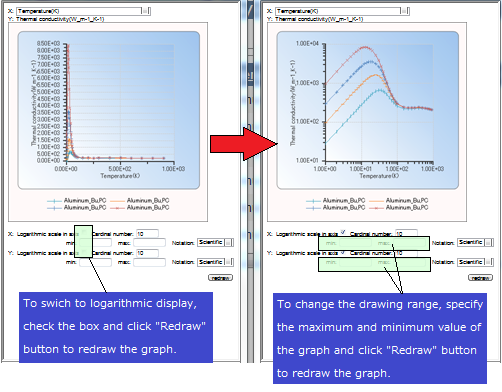
Figure 3-5 Graph
|
Browsing system by web browser
It is possible to use simple search or data comparison of the browse system without depending on a certain OS or browser.
|